The Future of Web Dev
The Future of Web Dev
GitHub-Style Activity Graph with shadcn/ui Calendar Heatmap
Add GitHub-style activity visualization to Next.js apps with this shadcn/ui calendar heatmap component. Includes tooltips and customizable colors.
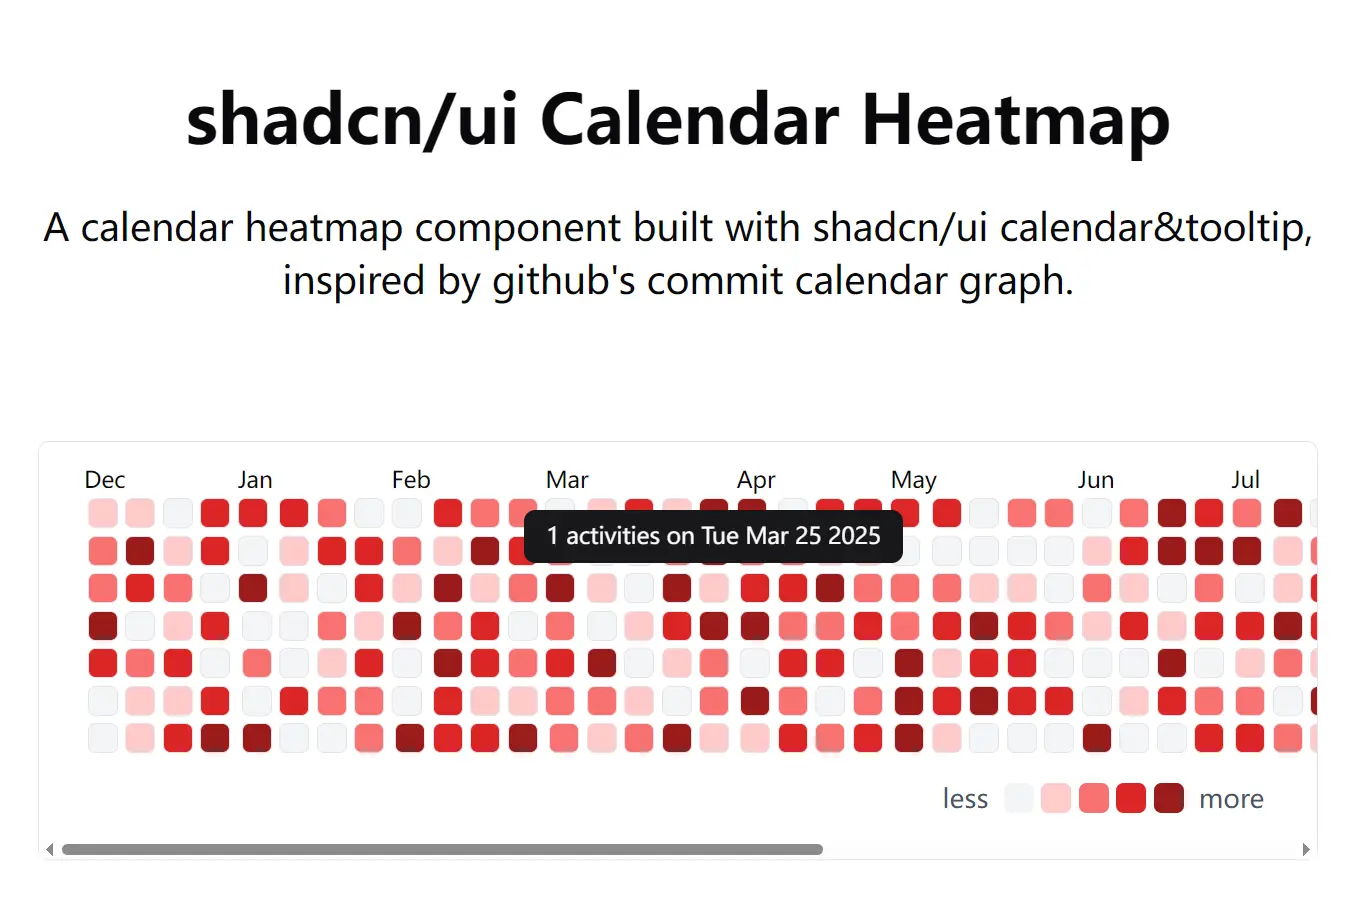
shadcn/ui Calendar Heatmap is a UI component that renders activity data as a calendar-based heatmap visualization.
The component extends shadcn/ui’s calendar and tooltip components to display daily activity counts across a 12-month period, similar to GitHub’s contribution graph.
Features
📅 12-Month Display: Shows a full year of data spanning 12 consecutive months from 11 months ago to the current date.
🎨 Color-Coded Intensity Levels: Maps activity counts from 0 to 4 to five distinct color variations using a red gradient scale.
💬 Interactive Tooltips: Displays activity count and date information when users hover over individual day cells.
📱 Responsive Layout: Includes horizontal scrolling for smaller viewports while maintaining the calendar structure.
🎯 TypeScript Support: Provides full type definitions for component props and data structures.
🔧 Customizable Styling: Uses CSS variables for box sizing and margins, with Tailwind classes for color schemes.
Use Cases
- Developer Activity Tracking: Monitor commit frequency or code review patterns across your team.
- Fitness Applications: Display workout consistency and exercise frequency over time.
- E-commerce Analytics: Visualize order volumes, customer interactions, or sales trends.
- Product Usage Metrics: Track daily active users or feature engagement patterns.
How to Use It
1. Install the necessary components and utilities.
npm install react-day-picker date-fns clsx tailwind-merge
npx shadcn-ui@latest add calendar tooltip
2. Prepare your activity data. Create an array where each object contains a Date instance and a numeric count value between 0 and 4. Higher counts correspond to darker shades in the heatmap.
const activityData: CalendarHeatmapData[] = [
  { date: new Date('2024-11-24'), count: 3 },
  { date: new Date('2024-11-23'), count: 1 },
  { date: new Date('2024-11-22'), count: 0 },
  // Add entries for each day you want to track
];
3. Import and render the component in your application. Pass your prepared data array to the data prop.
import CalendarHeatmap from "./components/CalendarHeatmap";

function Dashboard() {
  const userActivity = fetchUserActivityData(); // Your data source

  return (
    <div className="p-8">
      <h2 className="text-2xl font-semibold mb-4">Activity Overview</h2>
      <CalendarHeatmap data={userActivity} />
    </div>
  );
}
The component automatically calculates the date range starting from 11 months before the current date. Days without matching data entries display as the lowest intensity level. The tooltip shows the count value and formatted date when users hover over any day cell.
4. Customize the color scheme by modifying the heatmapClassNames object inside the component. Replace the Tailwind background color classes with your preferred color values.
const heatmapClassNames = {
  zero: "bg-gray-100",
  one: "bg-blue-200",
  two: "bg-blue-400",
  three: "bg-blue-600",
  four: "bg-blue-800",
};
FAQs
Q: Can I display more than 12 months of data?
A: The component currently sets numberOfMonths to 12 in the Calendar component. You can modify this value in the component code to display a longer time range.
Q: How do I handle dates that fall outside the tracked period?
A: The component automatically marks days outside the 12-month range with transparent backgrounds using the day_outside class. These dates will not display any activity indicators regardless of the data you provide.
Q: What happens if my data includes count values greater than 4?
A: The heatmapModify function only categorizes counts from 0 to 4. Any values above 4 will not match any modifier and will display with the default styling. You should normalize your data to fit within the 0-4 range before passing it to the component.
Q: Can I change the starting month for the calendar display?
A: Yes. The component calculates elevenMonthAgo to determine the starting month. You can modify this calculation or replace it with a custom date to start the calendar from a different point in time.
Q: Does the component work with server-side rendering?
A: Yes. The component uses standard React patterns and does not rely on browser-specific APIs during the initial render. You can use it in Next.js applications with both client and server components.