The Future of Web Dev
The Future of Web Dev
Next.js Leaflet Starter Template for Interactive Maps
Build interactive maps with this Next.js starter template. Includes Leaflet integration, multiple tile providers, and measurement tools for production apps.
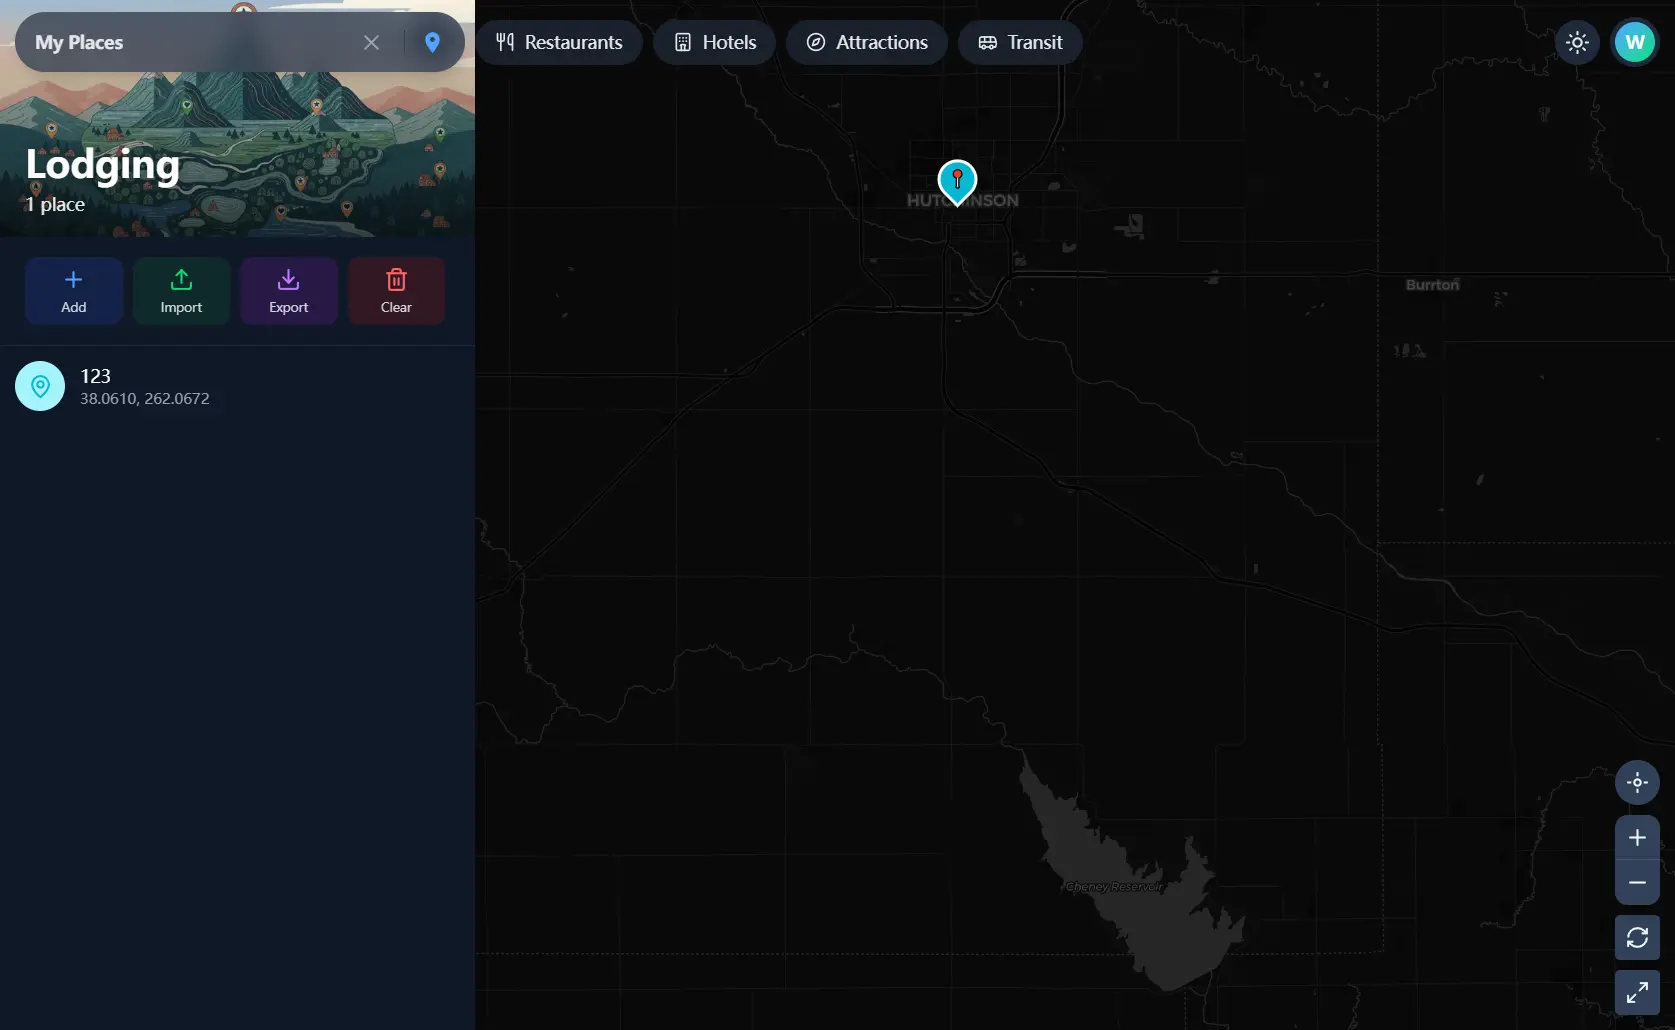
Next.js Leaflet Starter is a production-ready template that allows you to create interactive mapping applications using Next.js, shadcn/ui, and vanilla Leaflet map library.
The template handles server-side rendering through Next.js App Router while maintaining clear client boundaries for map interactions.
You can start building location-based features immediately without configuring Leaflet integration, tile providers, or responsive layouts.
Features
🗺️ Multiple Tile Providers: Switch between OpenStreetMap, satellite imagery from Esri, and dark mode tiles from CARTO.
🎨 Theme-Aware Basemaps: Map styles automatically adjust when users toggle between light and dark modes.
📍 Point of Interest Management: Create, update, and delete custom places with 14 category types including food, transport, lodging, and health services.
🎯 Interactive Location Picker: Select map coordinates through click interaction with live cursor tracking and visual crosshair feedback.
📊 GeoJSON Support: Render geographic features with custom styling and fly-to animations.
🔍 Debounced Country Search: Filter locations with keyboard navigation support for arrow keys, Enter, and Escape.
📐 Measurement Tools: Calculate distance and area directly on the map with interactive drawing capabilities.
💾 LocalStorage Persistence: All custom places save automatically without external databases.
📤 GeoJSON Import/Export: Share place collections or create backups in standard format.
🎯 Map Controls: Access zoom, fullscreen, geolocation, and view reset functions.
📱 Responsive Interface: Drawer UI on mobile screens transitions to side panels on desktop.
🔔 Toast Notifications: Color-coded feedback appears for all map actions.
🌙 Dark Mode Support: Theme preferences persist across sessions.
⚡ Server Components: Next.js 16 App Router optimizes client boundaries for better performance.
🖱️ Context Menu Actions: Right-click anywhere to copy coordinates, add markers, or save places.
Use Cases
- Location Directory Applications: Build restaurant finders, store locators, or service provider maps with category filtering and custom place management.
- Geographic Data Visualization: Display demographic information, environmental data, or business analytics using GeoJSON layers with theme-aware styling.
- Travel Planning Tools: Create trip itineraries with saved points of interest, measurement tools for distance calculation, and export functionality for sharing routes.
- Real Estate Platforms: Show property listings with custom markers, neighborhood boundaries, and measurement tools for lot sizes or distances to amenities.
How to Use It
1. Clone the repository and install dependencies through npm:
git clone https://github.com/wellywahyudi/nextjs-leaflet-starter.git
cd nextjs-leaflet-starter
npm install
2. Start the development server. The landing page loads at http://localhost:3000. Navigate to /map to access the interactive map interface.
npm run dev3. Modify default map settings in constants/map-config.ts:
export const DEFAULT_MAP_CONFIG: MapConfig = {
  defaultCenter: [40.7128, -74.0060], // New York City
  defaultZoom: 12,
  minZoom: 3,
  maxZoom: 18,
};
The defaultCenter property accepts latitude and longitude coordinates as a two-element array. The defaultZoom value determines initial map scale, while minZoom and maxZoom constrain user zoom interactions.
4. Register new basemap sources in constants/tile-providers.ts:
export const TILE_PROVIDERS: TileProvider[] = [
  {
    id: "custom-streets",
    name: "Custom Street Map",
    url: "https://tiles.example.com/{z}/{x}/{y}.png",
    attribution: "© Example Maps",
    maxZoom: 19,
    category: "standard",
  },
];
The template automatically generates UI controls for tile switching. The category field groups providers in the switcher interface.
5. The POI system stores data in browser LocalStorage. Create a new place through the map interface:
// Example POI structure
interface POI {
  id: string;
  name: string;
  category: POICategory;
  coordinates: [number, number];
  description?: string;
  createdAt: string;
}
Access POI data programmatically through the MapContext:
import { useMapContext } from '@/contexts/MapContext';
function CustomComponent() {
  const { pois, addPOI, updatePOI, deletePOI } = useMapContext();
  const handleCreatePlace = (lat: number, lng: number) => {
    addPOI({
      name: "New Restaurant",
      category: "food_drink",
      coordinates: [lat, lng],
      description: "Italian cuisine"
    });
  };
}
6. Place GeoJSON files in the public/data directory. Load and render geographic features:
import { LeafletGeoJSON } from '@/components/map/LeafletGeoJSON';
function MapPage() {
  return (
    <LeafletMap>
      <LeafletGeoJSON
        url="/data/countries.geojson"
        style={{
          fillColor: "#3b82f6",
          fillOpacity: 0.2,
          color: "#1e40af",
          weight: 2
        }}
      />
    </LeafletMap>
  );
}
The component applies custom styling to features and handles fly-to animations when users interact with rendered shapes.
7. Create new control components using the map context:
import { useMapContext } from '@/contexts/MapContext';
function CustomControl() {
  const { map } = useMapContext();
  const handleResetView = () => {
    if (map) {
      map.setView([40.7128, -74.0060], 12);
    }
  };
  return (
    <button onClick={handleResetView}>
      Reset View
    </button>
  );
}
8. Enable measurement mode through the MapMeasurementPanel component. Users can draw polylines for distance or polygons for area calculations:
import { MapMeasurementPanel } from '@/components/map/MapMeasurementPanel';
function MapInterface() {
  return (
    <>
      <LeafletMap />
      <MapMeasurementPanel />
    </>
  );
}
The panel displays live calculations as users add points. Results appear in both metric and imperial units.
9. Right-click functionality activates through MapContextMenu:
import { MapContextMenu } from '@/components/map/MapContextMenu';
function MapInterface() {
  const handleMenuAction = (action: string, latlng: LatLng) => {
    switch(action) {
      case 'add_marker':
        // Handle marker creation
        break;
      case 'copy_coords':
        // Copy coordinates to clipboard
        break;
    }
  };
  return (
    <>
      <LeafletMap />
      <MapContextMenu onAction={handleMenuAction} />
    </>
  );
}
10. All available components.
| Component | Description |
|---|---|
LeafletMap | The main container that initializes the Leaflet instance. |
LeafletTileLayer | Manages the active tile layer and handles theme switching. |
LeafletGeoJSON | Renders GeoJSON data on the map with custom styles. |
LeafletMarker | Displays individual markers with interactive popups. |
MapControls | UI buttons for zoom, fullscreen, geolocation, and reset. |
MapTileSwitcher | Interface for users to switch between map styles. |
MapSearchBar | Input field for searching countries with autocomplete. |
MapContextMenu | Right-click menu for actions like “Add Marker” or “Measure”. |
MapPOIPanel | Side panel for managing saved locations (CRUD). |
MapMeasurementPanel | Tools for measuring distance and area on the map. |
Related Resources
- React Leaflet: Build Leaflet maps using React components with hooks and declarative patterns.
- Mapbox GL JS: Render vector maps with WebGL for smooth interactions and custom styling options.
- Leaflet.js: Access the core JavaScript library for mobile-friendly interactive maps.
- OpenLayers: Display map data from various sources in web applications with extensive layer support.
FAQs
Q: How do I connect the POI system to a backend database?
A: Replace the LocalStorage calls in the MapContext with API requests to your backend. Modify the addPOI, updatePOI, and deletePOI methods to make fetch requests.
Q: Does the template support marker clustering for large datasets?
A: The current version does not include clustering. Add the Leaflet.markercluster plugin and wrap POI markers in a cluster group when rendering more than 100 points. The existing marker rendering logic in LeafletMarker components works with cluster groups without major changes.
Q: Can I deploy this to platforms other than Vercel?
A: The template works on any Node.js hosting platform that supports Next.js. Deploy to AWS Amplify, Netlify, or DigitalOcean App Platform by following their Next.js deployment guides.
Q: How do I add custom marker icons for different POI categories?
A: Create icon definitions in constants/poi-icons.ts mapping each category to a Leaflet icon configuration. Modify the LeafletMarker component to read the category from POI data and apply the corresponding icon. Use Lucide React icons or custom SVG files for marker graphics.