The Future of Web Dev
The Future of Web Dev
Build Interactive Charts with shadcn/ui & Recharts – EvilCharts
Create beautiful animated charts with EvilCharts. Built on shadcn/ui and Recharts with smooth transitions and responsive design.
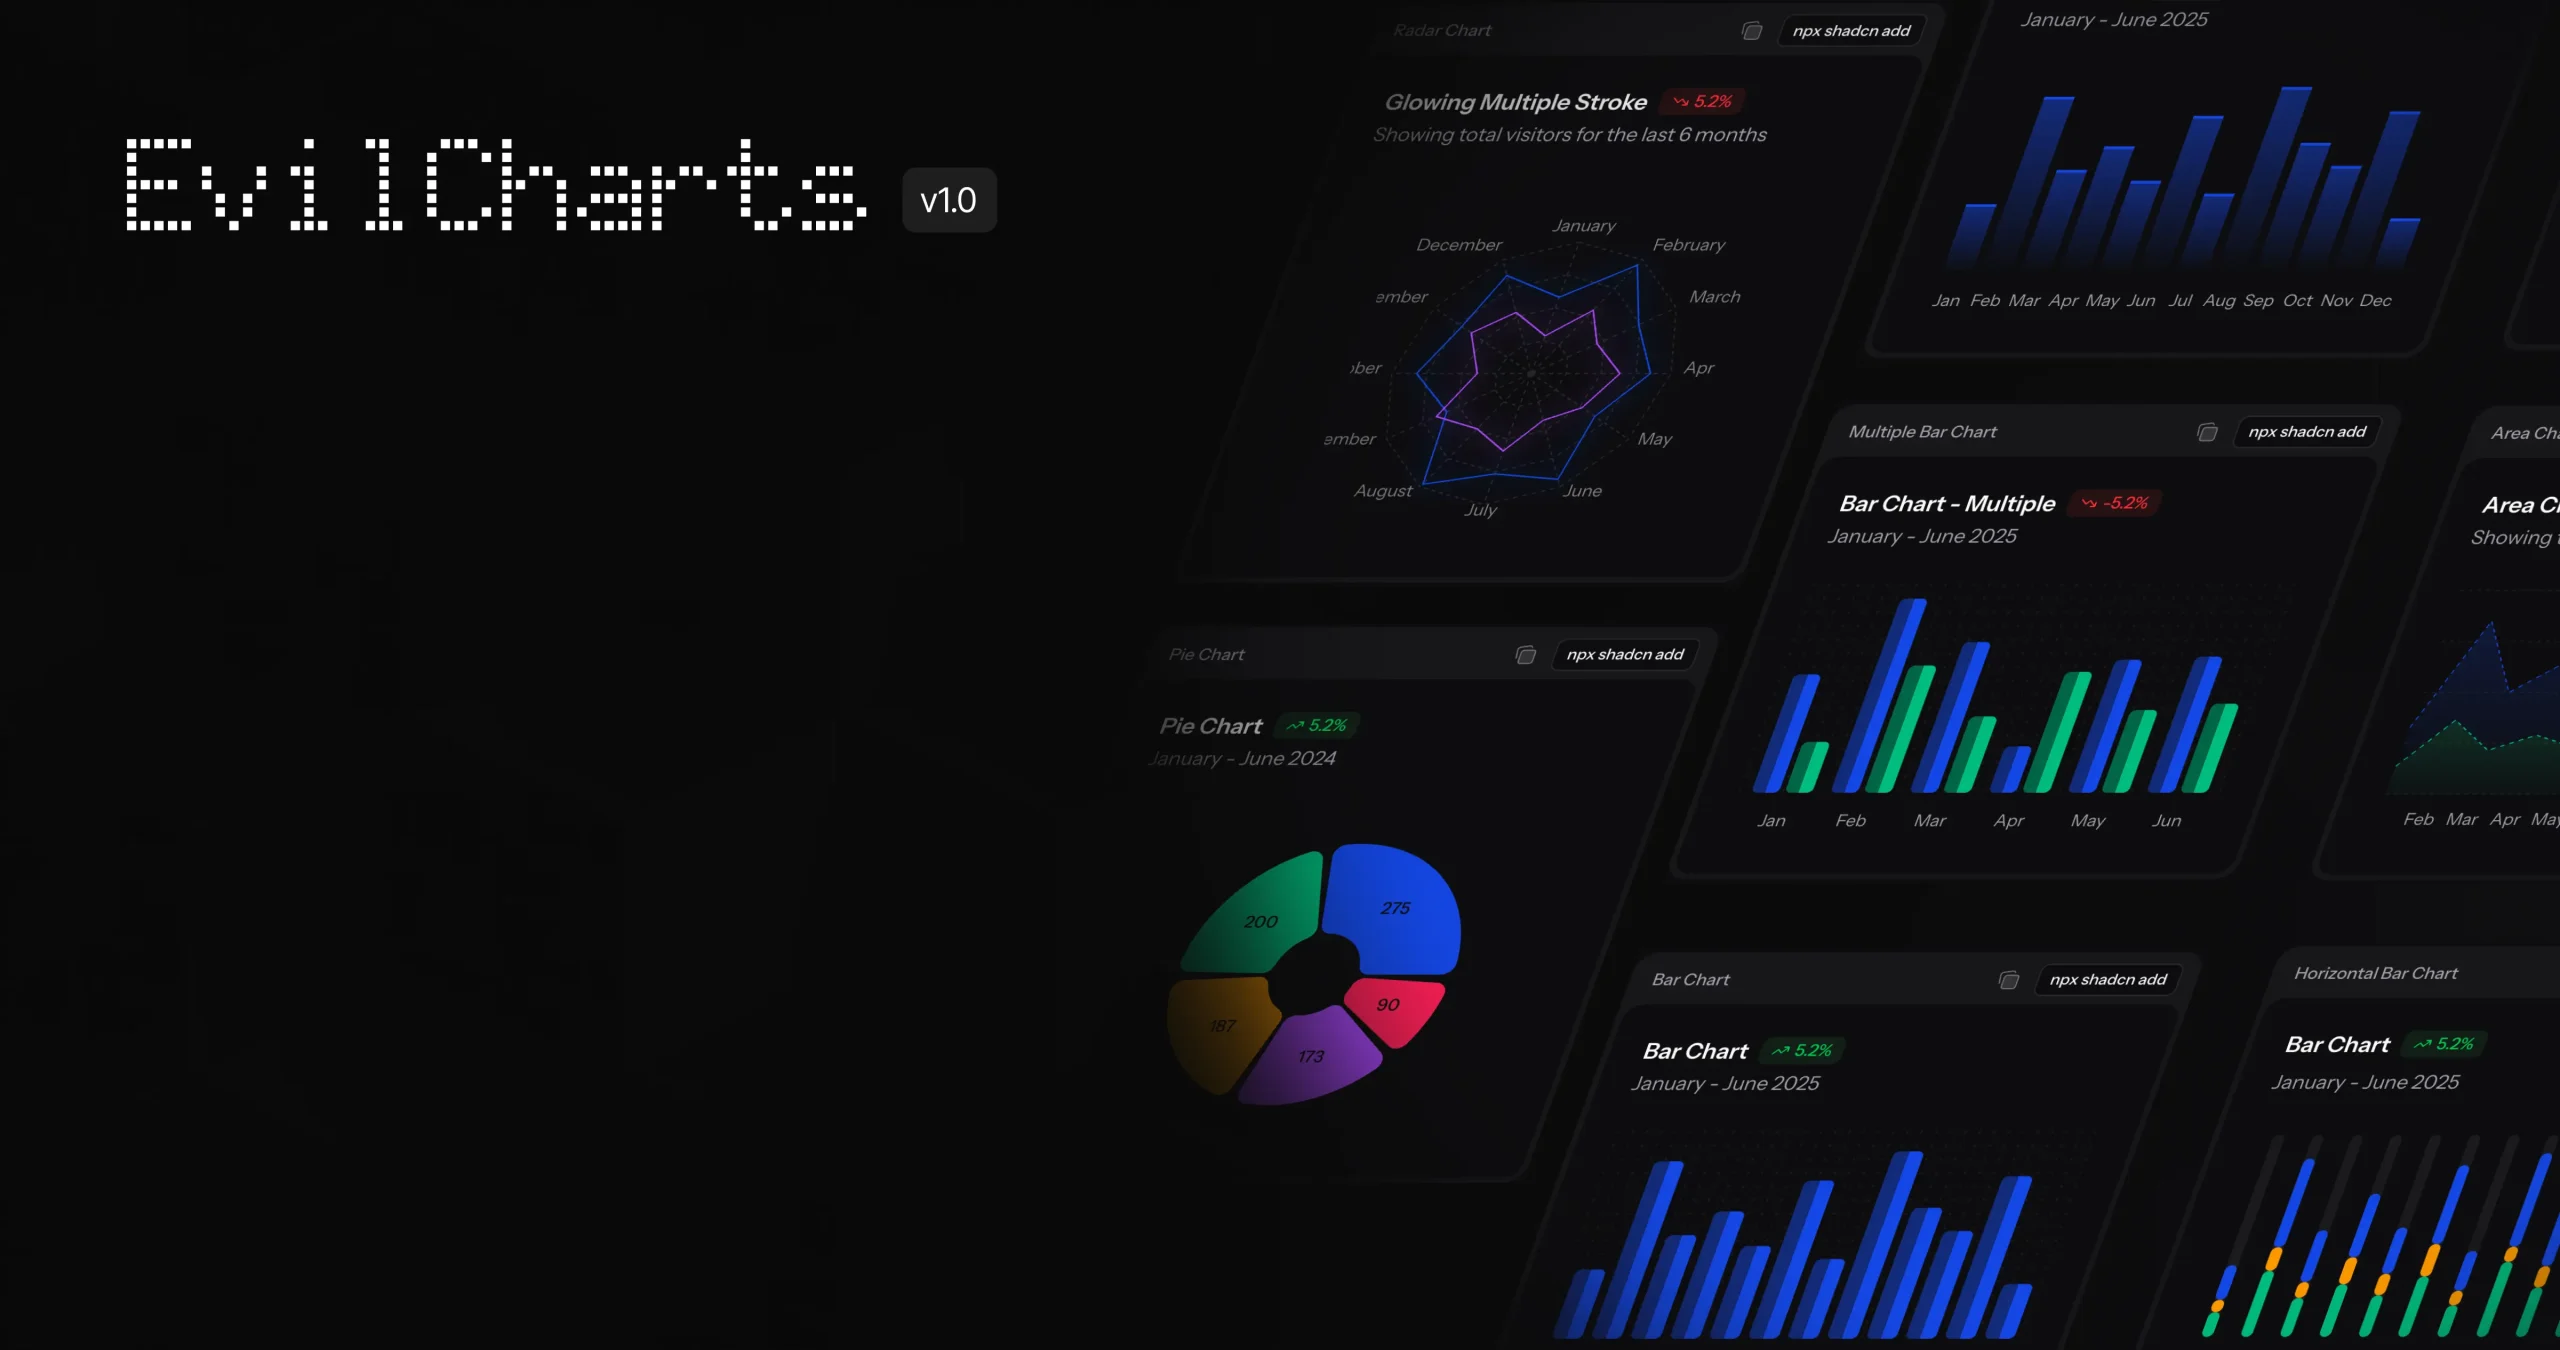
EvilCharts is a modern chart library for React and Next.js applications, built with shadcn/ui and Recharts.
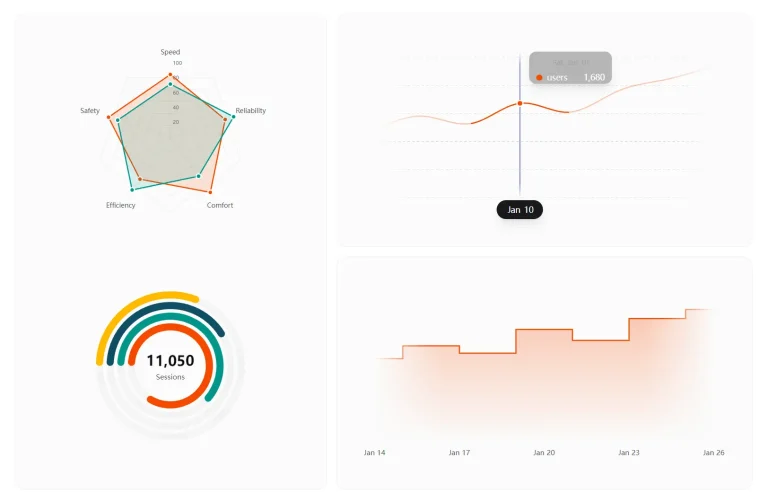
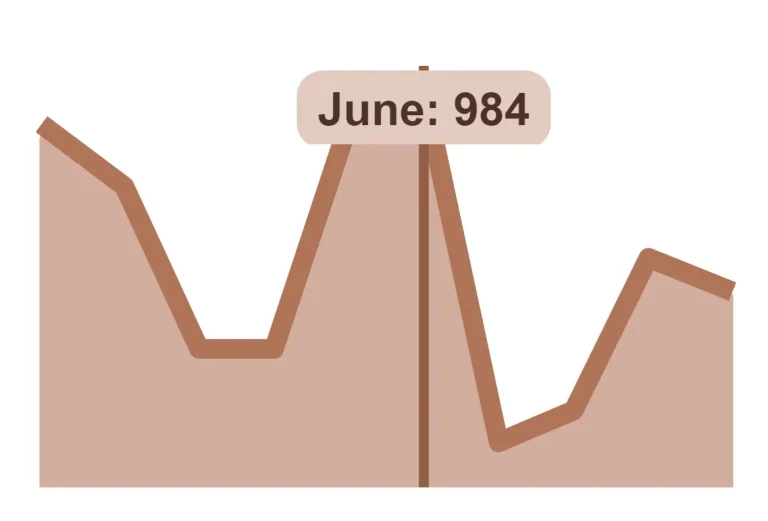
It comes with multiple chart types, including bar, line, area, pie, and radar charts with built-in animations and interactive features.
Each chart type follows design system principles that ensure consistency across your web app while allowing customization of styles and patterns.
Features
🎨 Pre-designed chart components with professional styling.
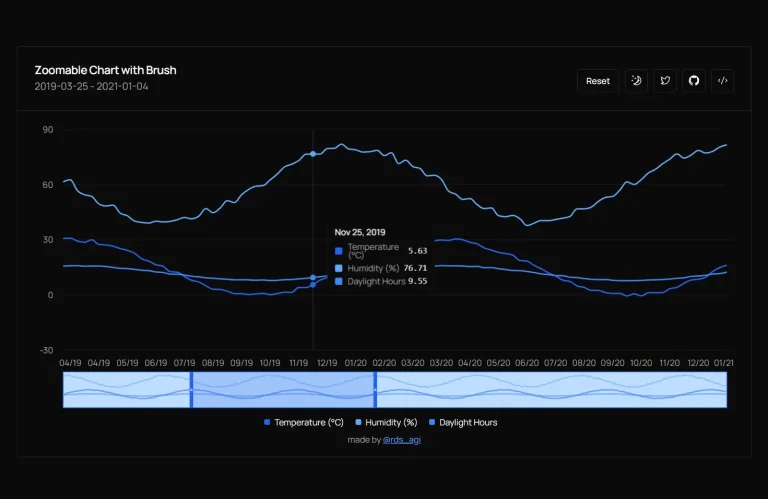
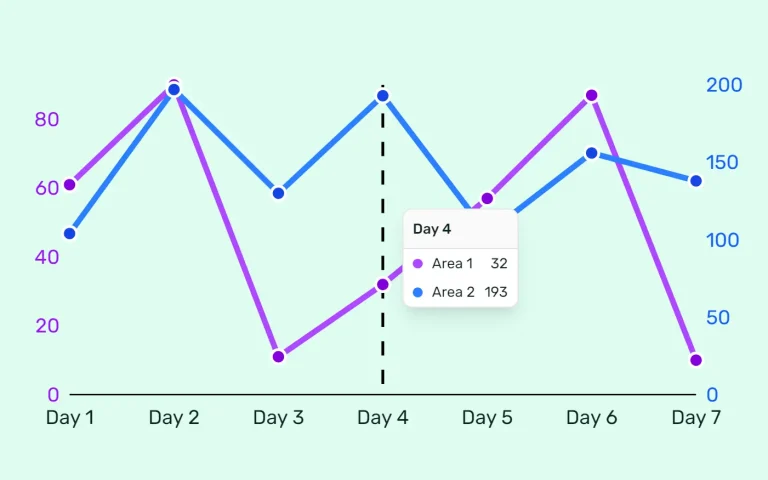
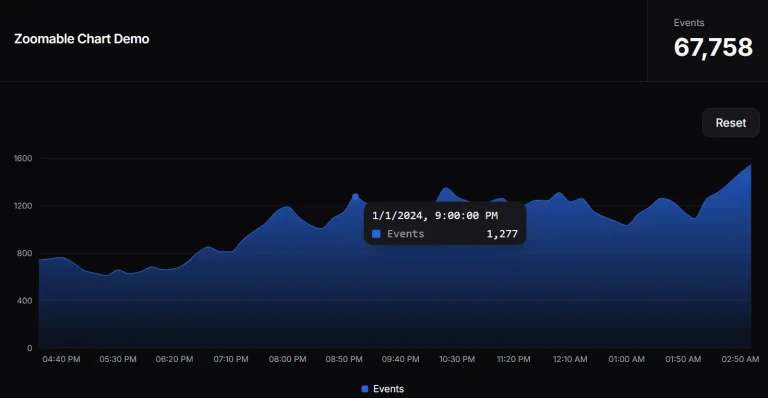
✨ Animated transitions and interactive visualizations that respond to user interactions and data changes.
🎭 Customizable styles, patterns, and visual effects, including dotted backgrounds and gradient fills.
📱 Fully responsive design that adapts to different screen sizes and device orientations.
🔧 Simple installation process with shadcn CLI integration for quick component addition.
💻 TypeScript support for type safety and better developer experience.
Use Cases
- Business Intelligence Dashboards. You can display key performance indicators and business metrics with interactive bar and line charts.
- Website Analytics Reports. You can visualize user traffic, page views, and conversion rates using area and pie charts.
- Financial Applications. You can track stock prices, portfolio performance, or market trends with detailed line and area charts.
- User Profile Analytics. You can represent user skill sets or attribute distributions with radar charts.
How to Use It
1. EvilCharts requires Recharts for the core charting functionality and shadcn UI for the component structure.
npm install rechartsnpx shadcn-ui@latest init2. Add the required charts, label, and card components to your project with the following command.
npx shadcn-ui@latest add charts label card3. You can now add specific chart components directly from the EvilCharts repository. For instance, to add a default bar chart:
npx shadcn-ui@latest add https://evilcharts.com/chart/default-bar-chart.json4. After adding the component, you can import and use it in your application. The following example shows how to implement the DefaultBarChart component you just added.
"use client";
import { TrendingUp } from "lucide-react";
import { Bar, BarChart, XAxis } from "recharts";
import {
  Card,
  CardContent,
  CardDescription,
  CardHeader,
  CardTitle,
} from "@/components/ui/card";
import {
  ChartConfig,
  ChartContainer,
  ChartTooltip,
  ChartTooltipContent,
} from "@/components/ui/chart";
import { Badge } from "@/components/ui/badge";
const chartData = [
  { month: "January", desktop: 342 },
  { month: "February", desktop: 876 },
  { month: "March", desktop: 512 },
  { month: "April", desktop: 629 },
  { month: "May", desktop: 458 },
  { month: "June", desktop: 781 },
];
const chartConfig = {
  desktop: {
    label: "Desktop",
    color: "hsl(var(--chart-1))",
  },
} satisfies ChartConfig;
export function DefaultBarChart() {
  return (
    <Card>
      <CardHeader>
        <CardTitle>Bar Chart Example</CardTitle>
        <CardDescription>January - June 2025</CardDescription>
      </CardHeader>
      <CardContent>
        <ChartContainer config={chartConfig} className="min-h-[200px] w-full">
          <BarChart accessibilityLayer data={chartData}>
            <XAxis
              dataKey="month"
              tickLine={false}
              tickMargin={10}
              axisLine={false}
              tickFormatter={(value) => value.slice(0, 3)}
            />
            <ChartTooltip
              cursor={false}
              content={<ChartTooltipContent hideLabel />}
            />
            <Bar dataKey="desktop" fill="var(--color-desktop)" radius={4} />
          </BarChart>
        </ChartContainer>
      </CardContent>
    </Card>
  );
}
5. Check out the official document for the implementation of other chart types.
FAQs
Q: Is EvilCharts a standalone component library?
A: No, EvilCharts is a collection of pre-built chart components that depend on shadcn UI and Recharts. You must install and configure those two libraries in your project first.
Q: How do I customize the charts?
A: You can customize the charts by directly editing their source code. When you add a chart component using the CLI command, its code is added to your project, which gives you full control over its styles, logic, and behavior.
Q: How do I handle real-time data updates?
A: The charts automatically re-render when data props change, making real-time updates straightforward. Simply update your data state, and the animations will handle the transitions between different data states.