The Future of Web Dev
The Future of Web Dev
Composable SVG Charts for SolidJS – solid-charts
Add interactive SVG charts to SolidJS projects with solid-charts. Component-based, unstyled, and uses D3 for data handling.
solid-charts is a chart component library that uses SVG and D3.js for data visualization while maintaining a lightweight footprint.
You can use it to build custom charts by combining components like <Line>, <Axis>, and <Tooltip> to create exactly the visualization your project needs.
Features
🌲 Tree-Shaking Support – Unused components are automatically removed during bundling.
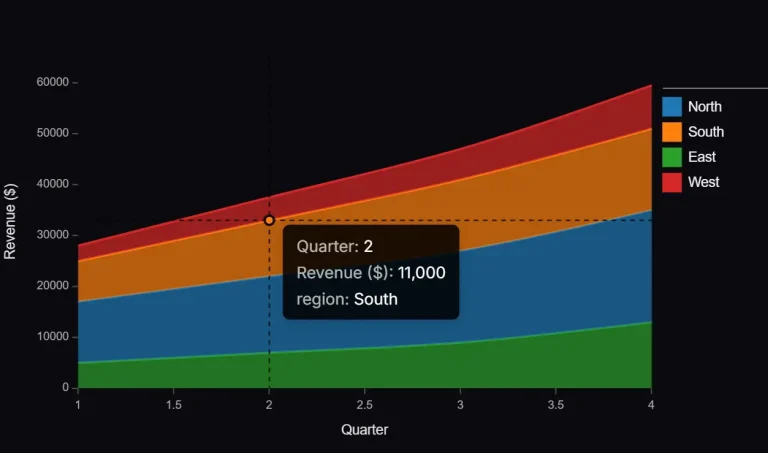
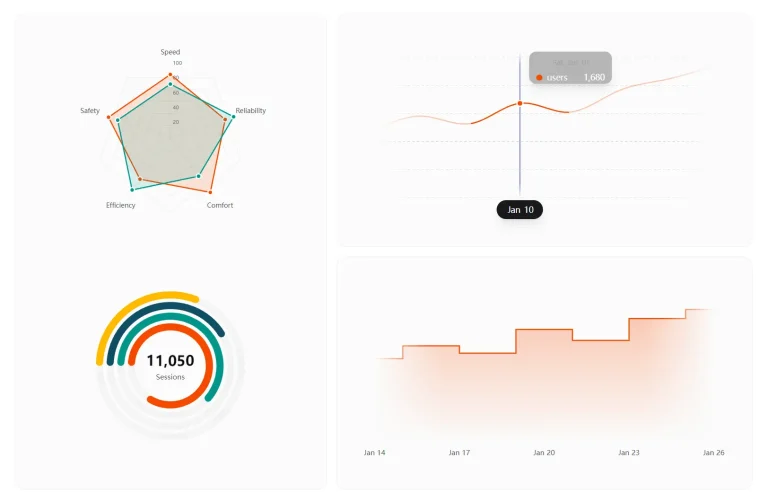
📊 Various Chart Types – Support for Line, Area, Bar, and Point charts.
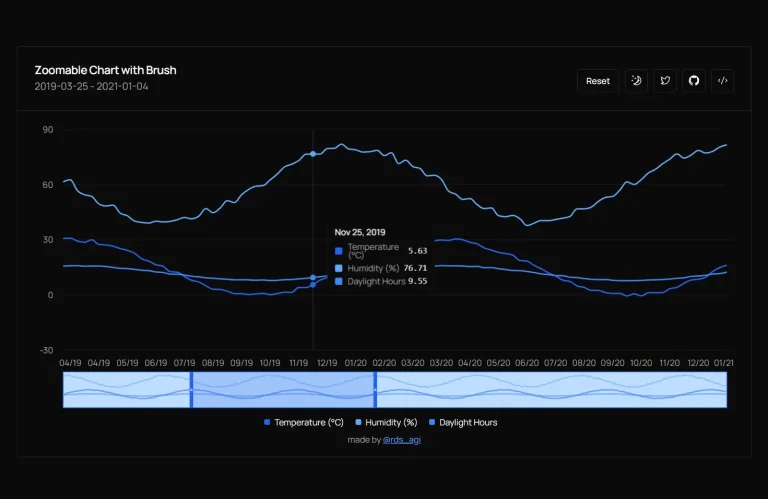
🔍 Axis Cursors – Visual guides that follow mouse movement for precise readings.
🎨 Unstyled by Default – Complete control over styling with any CSS approach.
📱 Responsive Design – Charts that adapt to container dimensions.
🛠️ Customizable Tooltips – Interactive data exploration with custom tooltips.
Use Cases
- Interactive Dashboards: Build dashboards that display real-time application metrics, user activity, or business intelligence data with various chart types.
- Data Reporting: Generate visual reports for financial analysis, sales performance, or scientific data, allowing users to understand trends and patterns.
- User Interface Enhancements: Add small, contextual charts within UI elements to provide quick visual insights, such as progress bars with historical data or inline sparklines.
- Educational Tools: Create interactive learning materials that explain complex datasets or mathematical concepts through visual representation.
- Monitoring Systems: Display live data feeds from sensors or system logs, such as server load, network traffic, or IoT device readings.
Installation
npm install solid-charts
# or
yarn add solid-charts
# or
pnpm add solid-charts
Usage
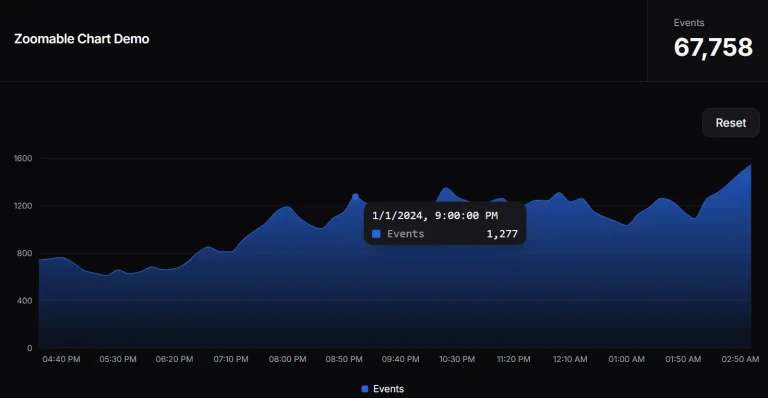
Here is an example of creating a simple line chart. This chart includes an x-axis, a y-axis, a tooltip, and a cursor line that appears on hover.
// index.tsx
import {
  Axis,
  AxisCursor,
  AxisGrid,
  AxisLabel,
  AxisLine,
  AxisTooltip,
  Chart,
  Line,
  Point,
} from 'solid-charts';
const values = [0, 3, 2, 5, 3, 6, 2];
const data = values.map((value, index) => ({
  xAxis: `Day ${index + 1}`,
  value,
}));
const MyChart = () => {
  return (
    <div class="h-62.5 text-sm w-125 m-6">
      <Chart data={data}>
        <Axis axis="y" position="left" tickCount={4}>
          <AxisLabel />
          <AxisGrid class="stroke-sc-text/20" />
        </Axis>
        <Axis dataKey="xAxis" axis="x" position="bottom">
          <AxisLabel />
          <AxisLine class="stroke-sc-text" />
          <AxisCursor
            stroke-dasharray="10,10"
            stroke-width={2}
            class="stroke-sc-text/70 transition-opacity"
          />
          <AxisTooltip class="rounded-md text-xs overflow-hidden shadow-lg border border-sc-200 bg-sc-bg">
            {(props) => (
              <>
                <div class="bg-sc-100 border-b border-sc-200 px-2 py-1 font-medium">
                  <p>{props.data.xAxis}</p>
                </div>
                <div class="flex items-center px-2 py-1">
                  <div class="rounded-full size-2 bg-sc-400" />
                  <p class="grow ml-1.5">Value</p>
                  <p class="ml-3">{props.data.value}</p>
                </div>
              </>
            )}
          </AxisTooltip>
        </Axis>
        <Line dataKey="value" class="text-sc-300" stroke-width={4} />
        <Point
          dataKey="value"
          class="text-sc-400 stroke-sc-100"
          r={5}
          stroke-width={2}
        />
      </Chart>
    </div>
  );
};
export default MyChart;
In this example, the <Chart> component wraps all other chart elements and receives the dataset. <Axis> components define the x and y axes, and <Line> and <Point> components render the data series. The <AxisTooltip> provides interactive data display on hover.
Related Resources
- SolidJS Documentation: The official documentation for SolidJS, the JavaScript framework solid-charts is built for. https://www.solidjs.com/docs/latest/api
- D3.js: The library solid-charts uses internally for data manipulation and scales. Understanding D3 concepts can be beneficial. https://d3js.org/
FAQs
Q: What makes solid-charts different from other charting libraries?
A: solid-charts focuses on component composition, giving you full control over which chart elements to include. This approach results in smaller bundle sizes through tree-shaking and provides maximum styling flexibility.
Q: Can I use solid-charts with SSR (Server-Side Rendering)?
A: Currently, solid-charts doesn’t support SSR due to its composable nature and use of contexts for chart registration. This is on the roadmap for future development.
Q: Which chart types does solid-charts currently support?
A: The library currently supports Line, Area, Bar, and Point charts. Additional types like Pie, Radar, and RadialBar are planned for future releases.
Q: How do I style the charts to match my application’s design?
A: solid-charts provides unstyled SVG elements that accept standard CSS classes and inline styling. This makes it compatible with any styling approach you prefer, including Tailwind CSS, CSS-in-JS, or plain CSS.
Preview