The Future of Web Dev
The Future of Web Dev
Optimize Svelte Apps with Sveltick Performance Tracker
A lightweight performance tracking library for Svelte apps. Monitor key metrics, set custom thresholds, and optimize your app today.
Sveltick is a lightweight performance-tracking library for Svelte applications.
It provides a simple way to monitor key performance metrics, identify bottlenecks, and ultimately enhance the user experience.
Features
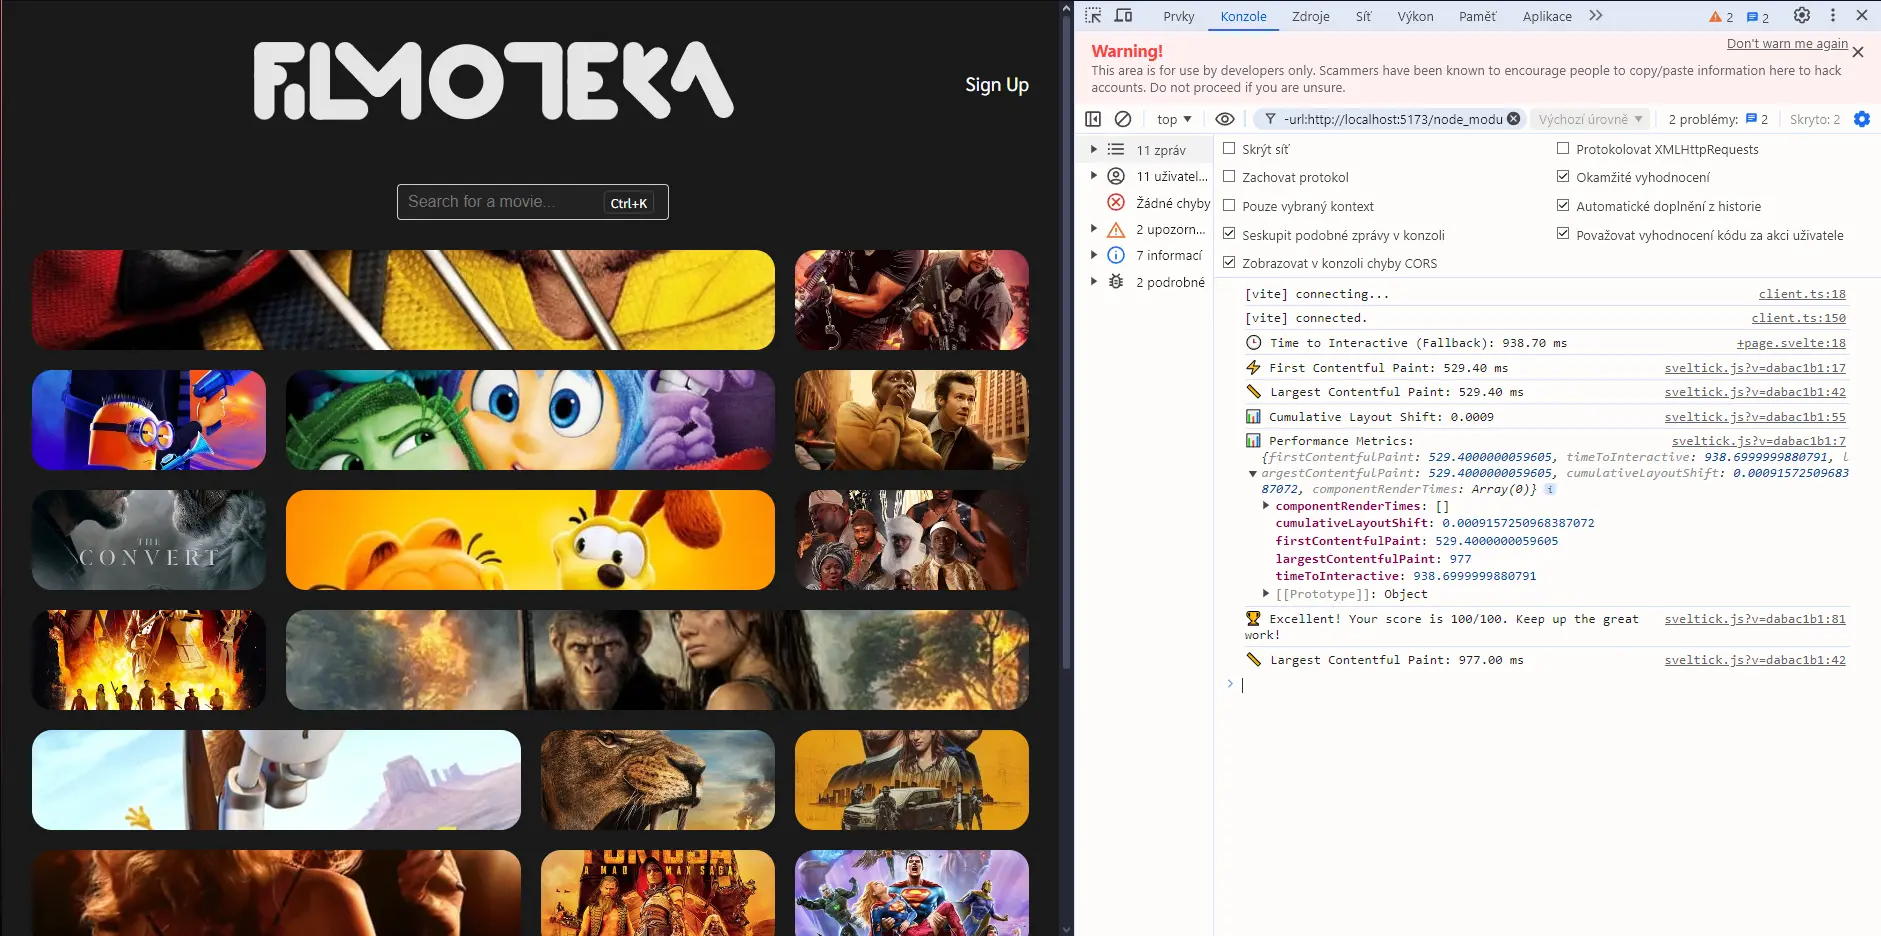
⚡️ Core Web Vitals Tracking: Monitor crucial metrics like First Contentful Paint (FCP), Largest Contentful Paint (LCP), Time to Interactive (TTI), and Cumulative Layout Shift (CLS).
📡 Network Performance: Measure Time to First Byte (TTFB) to identify potential server-side delays.
🔔 Customizable Alerts: Set thresholds for each metric and receive alerts when performance dips below acceptable levels.
✅ SvelteKit Support: Compatible with both SvelteKit and traditional Svelte projects.
🖱️ Interaction Metrics: Track First Input Delay (FID) and Interaction to Next Paint (INP) to understand how responsive your application is to user interactions.
🔧 Component-Level Tracking: Measure the render time of individual Svelte components to pinpoint performance bottlenecks.
🎮 Gamification: Sveltick offers a gamified performance scoring system, adding a fun element to performance optimization.
📈 Comprehensive Reporting: Access all performance data through a single API call, simplifying analysis and reporting.
Use Cases
- Optimizing Component Render Times: Identify slow-rendering components within a complex Svelte application and optimize their logic or structure to reduce render times. For example, if a data grid component is rendering slowly, Sveltick can help pinpoint the issue and enable targeted optimization efforts.
- Improving Initial Load Performance: Track FCP, LCP, and TTFB to identify opportunities to improve the initial loading experience for users. This might involve optimizing images, reducing JavaScript bundle sizes, or improving server response times.
- Monitoring Real-User Performance: Deploy Sveltick in production to gather real-world performance data. This data can reveal how users experience your application in different environments and network conditions, enabling targeted improvements.
- A/B Testing Performance Optimizations: Use Sveltick to compare the performance of different versions of your Svelte application or components, providing data-driven insights to support A/B testing efforts.
- Continuous Performance Monitoring: Integrate Sveltick into your CI/CD pipeline to continuously track performance metrics and identify regressions early in the development process.
Installation Guide
Install Sveltick using npm or yarn:
npm install sveltick
// or
yarn add sveltick
Usage Guide
1. Import Sveltick in your Svelte app:
import { onMount } from 'svelte';
import { runPerformanceTracker } from 'sveltick';
onMount(() => {
  runPerformanceTracker({
    trackMetrics: true,
    showAlerts: true,
    enableGamification: true,
    thresholds: {
      fcp: 1800,
      lcp: 2300,
      tti: 2800,
      cls: 0.15,
      fid: 100,
      inp: 200,
      ttfb: 800,
      componentRenderTime: 400
    }
  });
});
2. Track specific metrics:
import { onMount } from 'svelte';
import {
  trackFirstContentfulPaint,
  trackTimeToInteractive,
  trackLargestContentfulPaint,
  trackCumulativeLayoutShift,
  trackFirstInputDelay,
  trackInteractionToNextPaint,
  trackTimeToFirstByte
} from 'sveltick';
onMount(async () => {
  const fcp = await trackFirstContentfulPaint();
  const tti = await trackTimeToInteractive();
  const lcp = await trackLargestContentfulPaint();
  const cls = await trackCumulativeLayoutShift();
  const fid = await trackFirstInputDelay();
  const inp = await trackInteractionToNextPaint();
  const ttfb = await trackTimeToFirstByte();
  console.log(fcp, tti, lcp, cls, fid, inp, ttfb);
});
3. Track component render times:
import { onMount } from 'svelte';
import { trackComponentRender } from 'sveltick';
onMount(() => {
  const now = performance.now();
  const { name, renderTime } = trackComponentRender('YourComponent', now);
  console.log(name, renderTime);
});
4. Access performance metrics:
import { onMount } from 'svelte';
import { getPerformanceMetrics } from 'sveltick';
onMount(async () => {
  const metrics = await getPerformanceMetrics();
  console.log(metrics);
});
5. Check for performance alerts:
import { onMount } from 'svelte';
import { checkPerformanceAlerts } from 'sveltick';
onMount(() => {
  checkPerformanceAlerts({
    fcp: 1800,
    lcp: 2300,
    tti: 2800,
    cls: 0.15,
    fid: 100,
    inp: 200,
    ttfb: 800,
    componentRenderTime: 400
  });
});
6. Run gamification:
import { onMount } from 'svelte';
import { runGamification } from 'sveltick';
onMount(() => {
  runGamification();
});
Related Resources
- Svelte Official Documentation: https://svelte.dev/ – The official documentation for Svelte.
- Lighthouse: https://developer.chrome.com/docs/lighthouse/ – An open-source, automated tool for improving the quality of web pages, including performance audits.
- WebPageTest: https://www.webpagetest.org/ – A web performance testing tool that provides detailed performance metrics and waterfall charts.
Preview