The Future of Web Dev
The Future of Web Dev
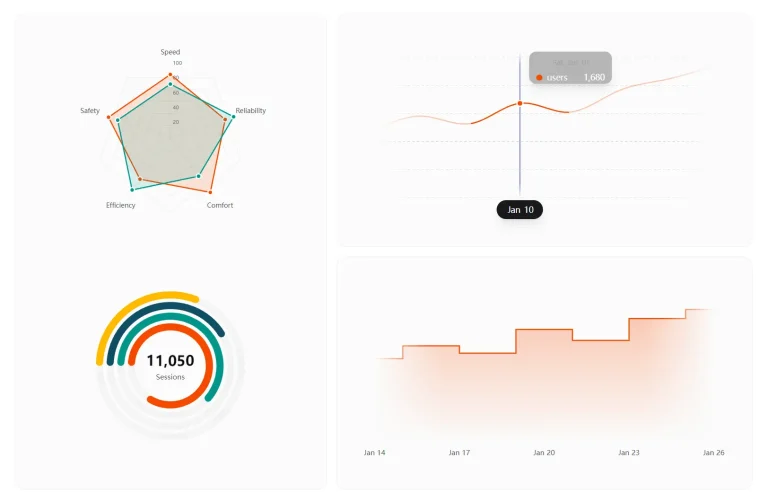
AI-Ready React Data Visualization with 38 Chart Types – Semiotic
A React data visualization library with 38 chart types, streaming charts, network graphs, SSR, and MCP-based AI tooling.
Semiotic is a React data visualization library that handles charting for static datasets, streaming metrics, and network structures.
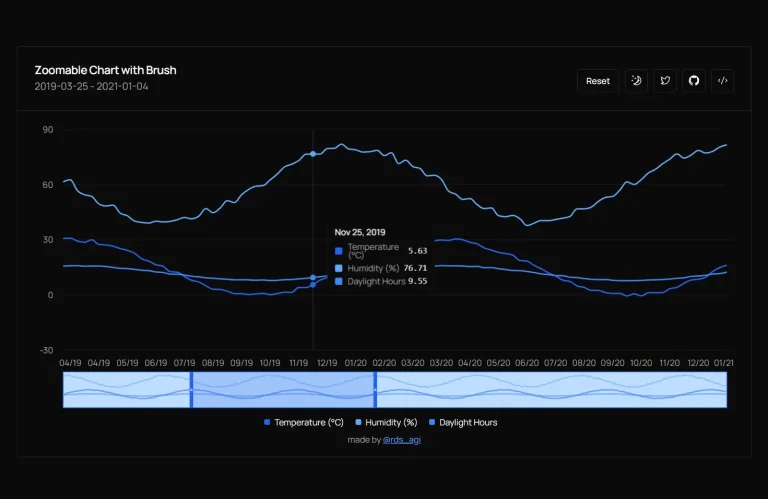
It currently supports 38+ chart components that span XY plots, categorical displays, network diagrams, geographic maps, and real-time streaming visuals.
The library renders to canvas in the browser while automatically generating SVG output in server environments.
This dual rendering approach means components work identically across Next.js App Router, Remix, and Astro apps.
Features
🤖 AI Tooling: Ships a machine-readable schema file, an MCP server, assistant instruction files for Claude, Cursor, Copilot, and Windsurf, and a CLI validator.
🖥️ Automatic SSR: All chart components detect server environments and render SVG.
📡 Streaming Charts: Realtime charts render on canvas at 60fps with a push-based data API and visual encodings for decay, pulse, and staleness.
🕸️ Network Visualization: Force-directed graphs, Sankey diagrams, chord diagrams, tree layouts, treemaps, circle packing, and orbit diagrams use the same accessor pattern as standard charts.
📦 11 Sub-path Entry Points: Each sub-path is a self-contained bundle.
📊 Statistical Charts: Box plots, violin plots, swarm plots, LOESS smoothing, forecast with confidence envelopes, anomaly detection, and marginal distribution graphics on scatterplot axes.
🔀 Vega-Lite Translation: Converts Vega-Lite specs to Semiotic configs and JSX, supporting bar, line, area, point, rect, arc, and tick marks with encoding translation for color, size, aggregation, and binning.
🗺️ Geographic Charts: Choropleth maps, animated flow maps, proportional symbol maps, and distance cartograms render on canvas with d3-geo projections, zoom/pan, tile basemaps, and globe drag-rotate.
Use Cases
- Build realtime system monitoring dashboards with decay effects, staleness badges, and threshold alerting.
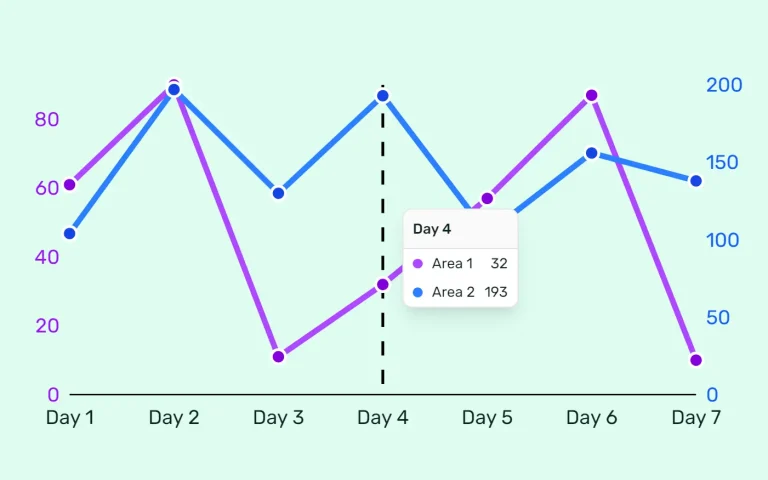
- Create coordinated analytics views where brushing a scatterplot filters a connected bar chart and summary table.
- Render network topology maps with click-to-inspect detail panels and particle animations along Sankey flows.
- Generate static chart SVGs on the server for email attachments or PDF report generation.
- Translate Vega-Lite notebook exports into editable React component code.
How to Use It
Table Of Contents
Installation
npm install semioticSub-path Imports
Import from the category sub-path that matches your chart type.
import { LineChart } from "semiotic/xy"
import { BarChart } from "semiotic/ordinal"
import { SankeyDiagram } from "semiotic/network"
import { ChoroplethMap } from "semiotic/geo"
Standard Charts
import { LineChart, BarChart } from "semiotic/xy"
<LineChart
  data={salesData}
  xAccessor="month"
  yAccessor="revenue"
  curve="monotoneX"
  showPoints
/>
<BarChart
  data={categoryData}
  categoryAccessor="department"
  valueAccessor="sales"
  orientation="horizontal"
  colorBy="region"
/>
Coordinated Dashboard
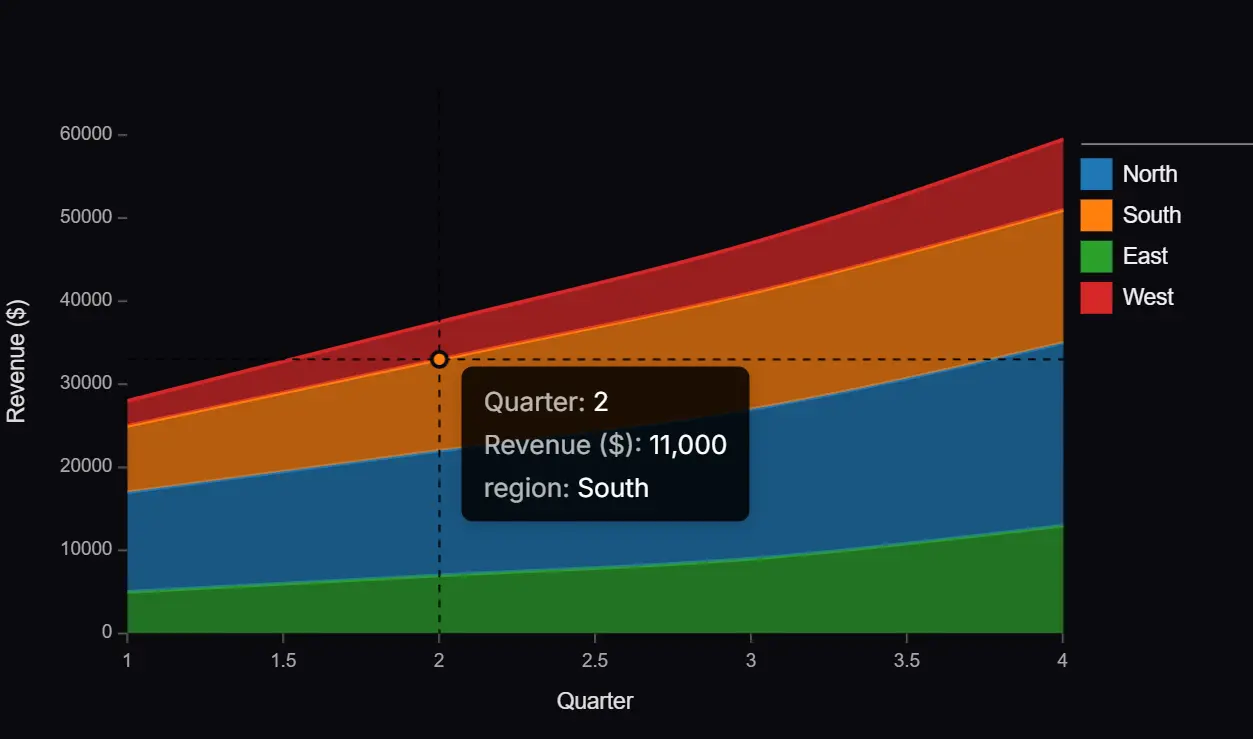
LinkedCharts syncs hover state and brush selection across chart types automatically. Wrap any combination of charts and pass matching linkedHover or selection names:
import { LinkedCharts, Scatterplot, BarChart } from "semiotic"
<LinkedCharts>
  <Scatterplot
    data={data}
    xAccessor="age"
    yAccessor="income"
    colorBy="region"
    linkedHover={{ name: "hl", fields: ["region"] }}
    selection={{ name: "hl" }}
  />
  <BarChart
    data={summary}
    categoryAccessor="region"
    valueAccessor="total"
    selection={{ name: "hl" }}
  />
</LinkedCharts>
Streaming Charts
RealtimeLineChart renders on canvas at 60fps. Push new data points via a ref from any event handler or interval:
import { RealtimeLineChart } from "semiotic/realtime"
import { useRef } from "react"
const chartRef = useRef()
// Call from a WebSocket handler, setInterval, or any callback
chartRef.current.push({ time: Date.now(), value: cpuLoad })
<RealtimeLineChart
  ref={chartRef}
  timeAccessor="time"
  valueAccessor="value"
  decay={{ type: "exponential", halfLife: 100 }}
  staleness={{ threshold: 5000, showBadge: true }}
/>
Network Graphs
Force-directed graphs and Sankey diagrams use the same accessor pattern as standard charts:
import { ForceDirectedGraph, SankeyDiagram } from "semiotic/network"
<ForceDirectedGraph
  nodes={people}
  edges={friendships}
  colorBy="team"
  nodeSize={8}
  showLabels
/>
<SankeyDiagram
  edges={budgetFlows}
  sourceAccessor="from"
  targetAccessor="to"
  valueAccessor="amount"
/>
Geographic Maps
import { ChoroplethMap, FlowMap, DistanceCartogram } from "semiotic/geo"
<ChoroplethMap
  areas={geoJsonFeatures}
  valueAccessor="gdp"
  colorScheme="viridis"
  projection="equalEarth"
  zoomable
  tooltip
/>
<FlowMap
  nodes={airports}
  flows={routes}
  valueAccessor="passengers"
  showParticles
  particleStyle={{ color: "source", speedMultiplier: 1.5 }}
/>
<DistanceCartogram
  points={cities}
  center="rome"
  costAccessor="travelDays"
  showRings
  costLabel="days"
  lines={routes}
/>
Streaming System Monitor
Combine StreamNetworkFrame, LinkedCharts, ChartContainer, and DetailsPanel for a live service topology view with click-to-inspect and threshold alerting:
import {
  StreamNetworkFrame,
  ChartContainer,
  DetailsPanel,
  LinkedCharts,
} from "semiotic"
const chartRef = useRef()
chartRef.current.push({ source: "API", target: "Orders", value: 15 })
<LinkedCharts>
  <ChartContainer
    title="System Monitor"
    status="live"
    detailsPanel={
      <DetailsPanel position="right" trigger="click">
        {(datum) => <div>{datum.id}: {datum.value} req/s</div>}
      </DetailsPanel>
    }
  >
    <StreamNetworkFrame
      ref={chartRef}
      chartType="sankey"
      showParticles
      particleStyle={{ proportionalSpeed: true }}
      thresholds={{ metric: (n) => n.value, warning: 100, critical: 250 }}
    />
  </ChartContainer>
</LinkedCharts>
Server-Side Rendering
Chart components render SVG in server environments automatically. The same import and the same props work across Next.js App Router, Remix, and Astro:
import { LineChart } from "semiotic/xy"
// Server renders <svg> elements; client hydrates to <canvas>
<LineChart data={data} xAccessor="date" yAccessor="value" />
For standalone image generation (email templates, OG images, PDFs, Slack attachments), use the server entry point:
import {
  renderChart,
  renderToImage,
  renderToAnimatedGif,
} from "semiotic/server"
// SVG — synchronous, no additional dependencies
const svg = renderChart("LineChart", {
  data,
  xAccessor: "date",
  yAccessor: "value",
  theme: "tufte",
  title: "Revenue Trend",
})
// PNG — async, requires sharp
const png = await renderToImage(
  "BarChart",
  { data },
  { format: "png", scale: 2 }
)
// Animated GIF — async, requires sharp and gifenc
const gif = await renderToAnimatedGif("line", data, {}, { fps: 12 })
TypeScript
Generics on chart components validate accessor props against your data type at compile time:
interface Sale {
  month: number
  revenue: number
}
<LineChart<Sale>
  data={sales}
  xAccessor="month"   // TS errors if "month" is not a key of Sale
  yAccessor="revenue"
/>
Vega-Lite Translation
Pass a Vega-Lite spec to fromVegaLite, then render it directly or convert it to JSX source code:
import { fromVegaLite } from "semiotic/data"
import { fromConfig, configToJSX } from "semiotic"
const config = fromVegaLite({
  mark: "bar",
  data: { values: [{ a: "A", b: 28 }, { a: "B", b: 55 }] },
  encoding: {
    x: { field: "a", type: "nominal" },
    y: { field: "b", type: "quantitative" },
  },
})
// Destructure to component name and props
const { componentName, props } = fromConfig(config)
// componentName: "BarChart"
// props: { data, categoryAccessor: "a", valueAccessor: "b" }
// Or generate JSX source
configToJSX(config)
// → <BarChart data={[...]} categoryAccessor="a" valueAccessor="b" />
AI-Assisted Development
Import from semiotic/ai to get all 38 chart components with a validation layer optimized for LLM code generation:
import { LineChart, BarChart, SankeyDiagram } from "semiotic/ai"Check a chart configuration programmatically with diagnoseConfig:
import { diagnoseConfig } from "semiotic/ai"
const result = diagnoseConfig("LineChart", {
  data: [],
  xAccessor: "date",
  yAccessor: "value",
})
// → ✗ [EMPTY_DATA] data is an empty array
//   Fix: provide at least one data point
MCP Server Setup
Add the MCP server entry to your client config (e.g., claude_desktop_config.json for Claude Desktop):
{
  "mcpServers": {
    "semiotic": {
      "command": "npx",
      "args": ["semiotic-mcp"]
    }
  }
}
CLI Validation
Validate component and props JSON from the terminal:
npx semiotic-ai --doctor    # validate component + props JSON with typo suggestions
npx semiotic-ai --schema    # dump all chart schemas
npx semiotic-ai --compact   # compact schema output for fewer tokens
All Chart Components
| Category | Components |
|---|---|
| XY | LineChart, AreaChart, StackedAreaChart, Scatterplot, ConnectedScatterplot, BubbleChart, Heatmap, QuadrantChart, MultiAxisLineChart, MinimapChart |
| Categorical | BarChart, StackedBarChart, GroupedBarChart, LikertChart, SwimlaneChart, FunnelChart, SwarmPlot, BoxPlot, Histogram, ViolinPlot, RidgelinePlot, DotPlot, PieChart, DonutChart |
| Network | ForceDirectedGraph, ChordDiagram, SankeyDiagram, TreeDiagram, Treemap, CirclePack, OrbitDiagram |
| Geo | ChoroplethMap, ProportionalSymbolMap, FlowMap, DistanceCartogram |
| Realtime | RealtimeLineChart, RealtimeHistogram, RealtimeSwarmChart, RealtimeWaterfallChart, RealtimeHeatmap |
| Coordination | LinkedCharts, ScatterplotMatrix |
| Layout | ChartGrid, ContextLayout, CategoryColorProvider |
| Frames | StreamXYFrame, StreamOrdinalFrame, StreamNetworkFrame, StreamGeoFrame |
Related Resources
- Recharts: A composable React chart library built on D3 with a large ecosystem and community examples for standard bar, line, and area charts.
- Apache ECharts: A JavaScript chart library for large datasets, with GPU-accelerated rendering that scales to millions of data points.
FAQs
Q: Do Semiotic charts work in Next.js App Router server components?
A: Yes. All chart components detect server environments and render SVG automatically. Static charts need no "use client" directive, no dynamic imports, and no special configuration.
Q: How do you minimize bundle size when only using one chart type?
A: Import from the matching sub-path (e.g., semiotic/xy for line and scatter charts). Each sub-path sets "sideEffects": false, so webpack, Rollup, Vite, and esbuild all tree-shake unused exports. Only the components you import end up in the bundle.
Q: Does the MCP server need API keys or a running cloud service?
A: No. The server runs locally via stdio. Add the npx semiotic-mcp command to your MCP client config and it starts on demand with no authentication.
Q: Can you migrate a Vega-Lite spec from a Jupyter notebook directly to React?
A: Yes. Pass the spec to fromVegaLite() from semiotic/data, then pass the result to fromConfig() to get the component name and props, or to configToJSX() to get the JSX source code. The translator covers bar, line, area, point, rect, arc, and tick marks.
Q: What is the difference between static and streaming chart usage?
A: Static charts accept a data array prop. Realtime charts take a ref and receive new data points via ref.current.push(). The decay, pulse, and staleness encoding options only apply to realtime chart components in semiotic/realtime.