The Future of Web Dev
The Future of Web Dev
Wick Charts: Real-time Canvas Charts for React, Vue and Svelte
An open-source Canvas charting library for React, Vue, and Svelte apps. It includes candlestick, depth, heatmap, and Sankey charts, plus Nuxt and shadcn/ui integrations.
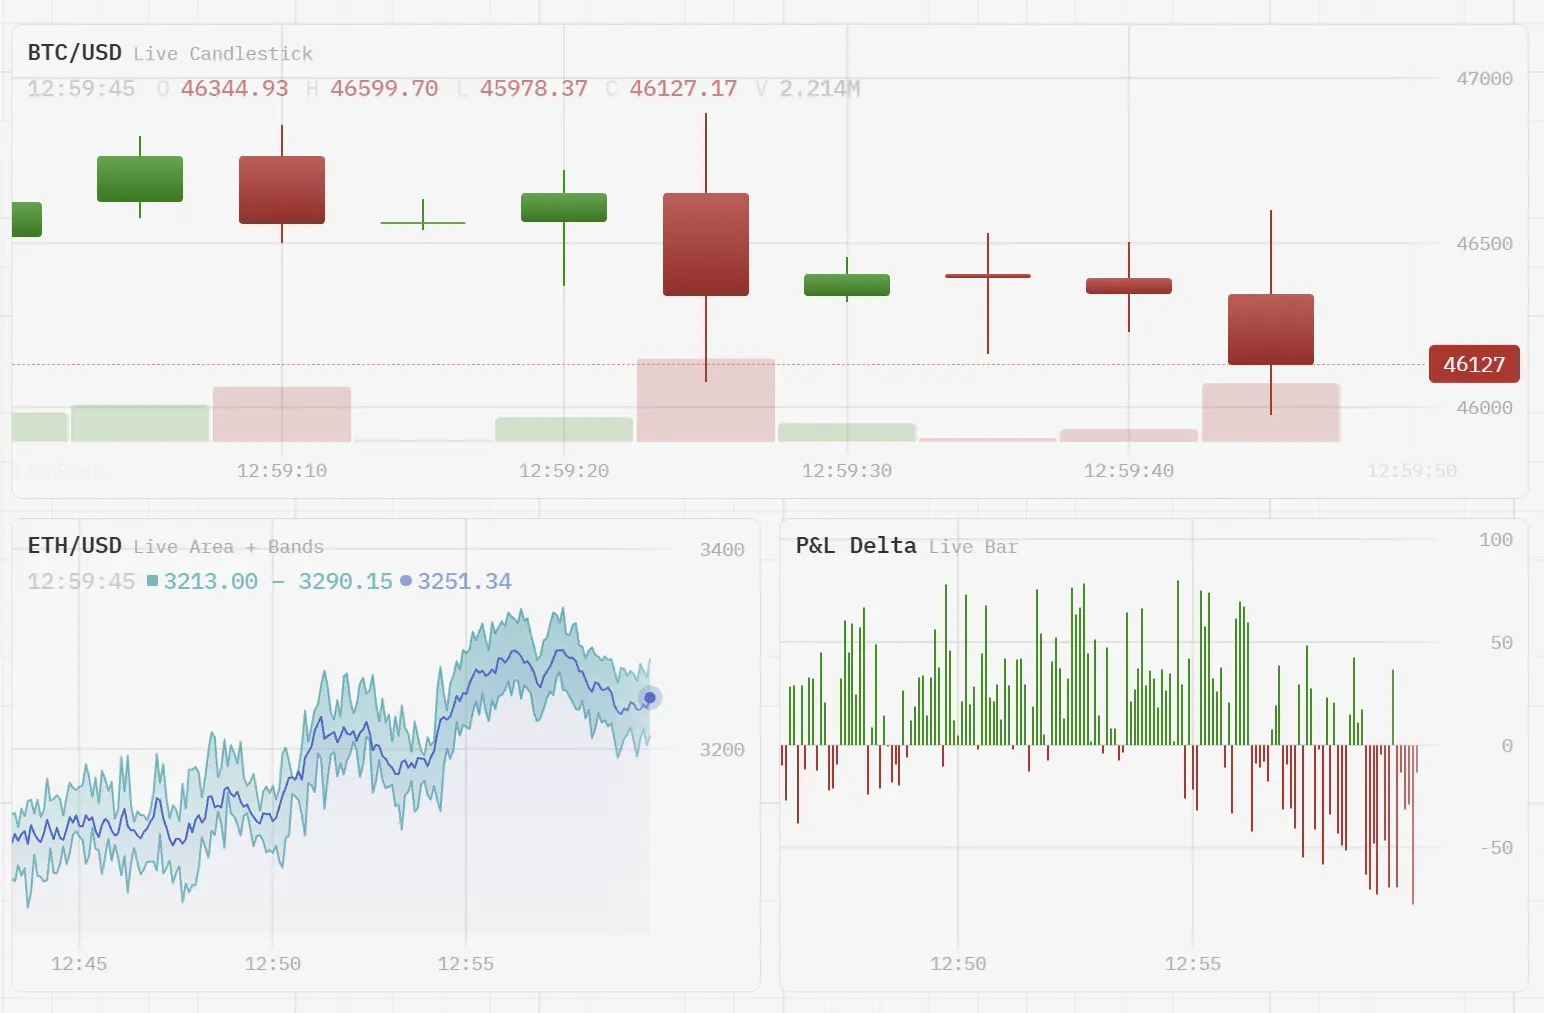
Wick Charts is an open-source Canvas charting library for React, Vue, and Svelte that renders live prices, metrics, and dashboard data.
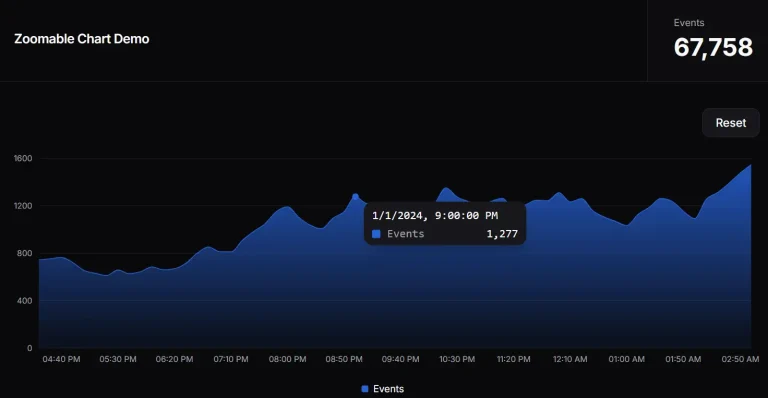
It supports animated data updates, zoomable time windows, and custom themes.
Features
- Nuxt module for auto-imported chart components and shadcn/ui registry blocks for React.
- Animated point insertion and last-value updates for streaming time-series data.
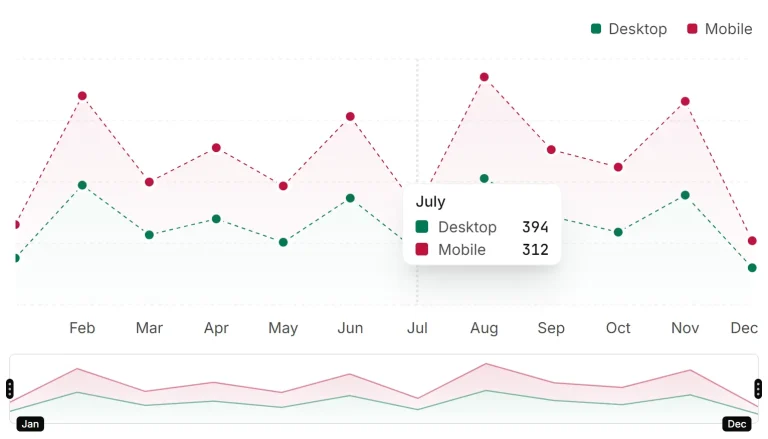
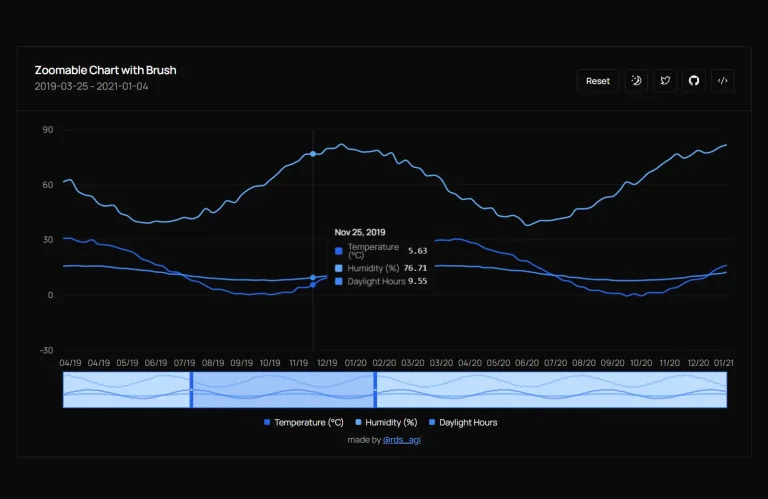
- Zoom, pan, crosshairs, tooltips, toggleable legends, and a range navigator.
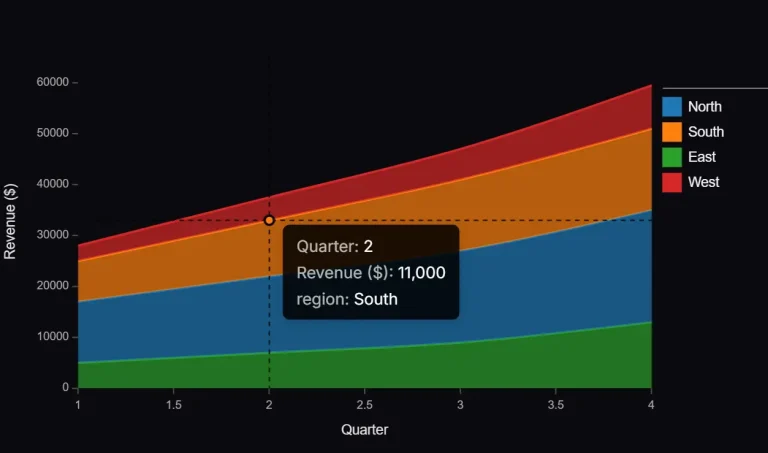
- Multiple series, normal and percentage stacking, secondary Y axes, and chart synchronization.
- Bundled themes,
createTheme()color customization, and a theme editor. - Custom series renderers and painters for chart-specific drawing.
- TypeScript declarations, tree-shakeable ESM packages, and an MIT license.
Use Cases
- Trading dashboards with live OHLC candles, volume data, and order-book depth.
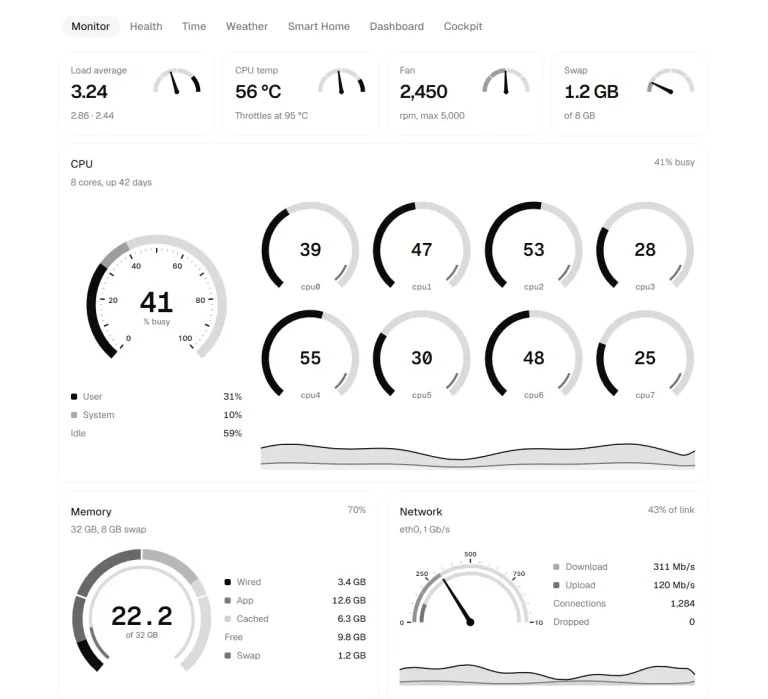
- Service monitoring with latency bands, CPU gauges, and incident markers.
- Product analytics with category bars, Sankey conversion flows, and compact KPI sparklines.
Available Chart Types
- Candlestick: OHLC prices with an optional volume pane.
- Line and Area: time-series lines, area fills, multiple layers, and stacking.
- Band: lower and upper bounds for latency percentiles or price envelopes.
- Bar: time-based or category-based bars, grouped or stacked.
- Pie and Donut: labeled proportions and configurable donut rings.
- Heatmap: categorical rows and columns colored by value.
- Order Book / Depth: cumulative bids and asks around a market price.
- Sankey: flows between nodes for funnels and allocation diagrams.
- Gauge: a value displayed on an arc with optional zones.
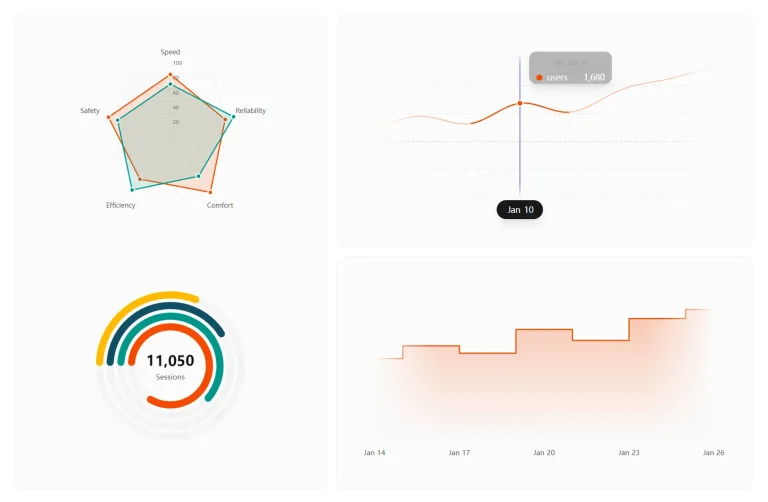
- Radial Progress: multiple concentric progress rings.
- Radar: values compared across radial axes.
- Sparkline: compact line and bar trends.
How to Use Wick Charts
Install the Framework Package
npm install @wick-charts/react   # React / Next.js
npm install @wick-charts/vue     # Vue 3
npm install @wick-charts/svelte  # Svelte
React and Next.js: Basic Usage
In Next.js App Router, render the chart inside a Client Component.
'use client';
import {
  ChartContainer,
  Crosshair,
  LineSeries,
  TimeAxis,
  Tooltip,
  YAxis,
  type TimePointInput,
} from '@wick-charts/react';
const points: TimePointInput[] = [
  { time: Date.UTC(2026, 10, 1), value: 120 },
  { time: Date.UTC(2026, 10, 2), value: 137 },
  { time: Date.UTC(2026, 10, 3), value: 129 },
  { time: Date.UTC(2026, 10, 4), value: 154 },
];
export default function RevenueChart() {
  return (
    <div style={{ height: 320 }}>
      <ChartContainer>
        <LineSeries data={points} options={{ area: { visible: true } }} />
        <YAxis />
        <TimeAxis />
        <Crosshair />
        <Tooltip />
      </ChartContainer>
    </div>
  );
}
Update a Chart With Streaming Data
Replace the data array when a reading arrives. Wick Charts detects appended points and changes to the latest value from the new array reference.
The example below appends one point per second.
'use client';
import { useEffect, useState } from 'react';
import {
  ChartContainer, LineSeries, TimeAxis, Tooltip, YAxis,
  type TimePointInput,
} from '@wick-charts/react';
const initial: TimePointInput[] = [
  { time: Date.UTC(2026, 10, 1), value: 100 },
  { time: Date.UTC(2026, 10, 1, 0, 0, 1), value: 105 },
];
export default function LiveMetricsChart() {
  const [data, setData] = useState(initial);
  useEffect(() => {
    const timer = window.setInterval(() => {
      setData((previous) => {
        const last = previous[previous.length - 1];
        const next = {
          time: Number(last.time) + 1000,
          value: Math.round((last.value ?? 0) + (Math.random() - 0.5) * 10),
        };
        return [...previous, next];
      });
    }, 1000);
    return () => window.clearInterval(timer);
  }, []);
  return (
    <div style={{ height: 320 }}>
      <ChartContainer>
        <LineSeries data={data} />
        <YAxis />
        <TimeAxis />
        <Tooltip />
      </ChartContainer>
    </div>
  );
}
Vue 3
Use a shallowRef for large streaming arrays and assign a new array on each update.
<script setup lang="ts">
import {
  ChartContainer, Crosshair, LineSeries,
  TimeAxis, Tooltip, YAxis, type TimePointInput,
} from '@wick-charts/vue';
defineProps<{ data: TimePointInput[] }>();
</script>
<template>
  <div style="height: 320px">
    <ChartContainer>
      <LineSeries :data="data" />
      <YAxis />
      <TimeAxis />
      <Crosshair />
      <Tooltip />
    </ChartContainer>
  </div>
</template>
Svelte
Keep large datasets in $state.raw and reassign the array on updates. This example uses Svelte 5 runes; in Svelte 4, declare the prop with export let data: TimePointInput[];.
<script lang="ts">
  import {
    ChartContainer, Crosshair, LineSeries,
    TimeAxis, Tooltip, YAxis, type TimePointInput,
  } from '@wick-charts/svelte';
  let { data }: { data: TimePointInput[] } = $props();
</script>
<div style="height: 320px">
  <ChartContainer>
    <LineSeries {data} />
    <YAxis />
    <TimeAxis />
    <Crosshair />
    <Tooltip />
  </ChartContainer>
</div>
Nuxt Module
Install the Nuxt 3.12+/Nuxt 4 module to register Wick-prefixed chart components and composables automatically:
npx nuxi module add @wick-charts/nuxt// nuxt.config.ts
export default defineNuxtConfig({
modules: ['@wick-charts/nuxt'],
});Use the registered components directly in a Nuxt page:
<script setup lang="ts">
import type { TimePointInput } from '@wick-charts/vue';
const readings: TimePointInput[] = [
  { time: Date.UTC(2026, 10, 1), value: 31 },
  { time: Date.UTC(2026, 10, 2), value: 37 },
  { time: Date.UTC(2026, 10, 3), value: 34 },
];
</script>
<template>
  <div style="height: 320px">
    <WickChartContainer>
      <WickLineSeries :data="readings" />
      <WickYAxis />
      <WickTimeAxis />
      <WickTooltip />
    </WickChartContainer>
  </div>
</template>
For custom auto-imports, use wickCharts.prefix (default Wick) and wickCharts.composables (default true) in nuxt.config.ts. Large datasets fetched through useFetch can use { server: false } for client-side loading.
Chart Data and Composition
LineSeries and BarSeries take { time, value } points. time accepts Unix milliseconds or a Date, and a null value breaks the line. CandlestickSeries takes { time, open, high, low, close, volume? }; supplying volume adds a volume pane.
Use { label?, color?, data } layers when a line or bar chart needs multiple datasets. Each label appears in the tooltip and legend; each color overrides the theme for that layer.
'use client';
import {
  ChartContainer, Legend, LineSeries, TimeAxis, YAxis,
  type TimePointInput,
} from '@wick-charts/react';
const revenue: TimePointInput[] = [
  { time: Date.UTC(2026, 10, 1), value: 120 },
  { time: Date.UTC(2026, 10, 2), value: 150 },
];
const costs: TimePointInput[] = [
  { time: Date.UTC(2026, 10, 1), value: 80 },
  { time: Date.UTC(2026, 10, 2), value: 92 },
];
export function SalesChart() {
  return (
    <div style={{ height: 320 }}>
      <ChartContainer>
        <LineSeries data={[
          { label: 'Revenue', color: '#0ea5e9', data: revenue },
          { label: 'Costs', color: '#f97316', data: costs },
        ]} />
        <YAxis />
        <TimeAxis />
        <Legend />
      </ChartContainer>
    </div>
  );
}
LineSeries Props
| Prop | Type and behavior |
|---|---|
data | Required. TimePointInput[], nested point arrays, one SeriesLayer<TimePointInput>, or an array of named layers. |
options | Optional Partial<LineSeriesOptions> for line geometry, fill, animation, and stacking. |
id | Optional stable series identifier. |
visible | Optional boolean, default true; a hidden series is excluded from autoscaling and overlays. |
scale | Optional scale ID for a secondary Y axis declared on ChartContainer. |
LineSeries Options
| Option | Behavior |
|---|---|
strokeWidth | Line width in CSS pixels; default 1. |
area | { visible?: boolean; baseline?: number }; area fill is visible by default. |
pulse | Toggle the animated dot at the latest point. |
pulseMs | Pulse cycle duration in milliseconds; default 600. |
stacking | Stacking mode, including normal and percentage; default 'off'. |
entryAnimation | New-point animation style; default 'grow'. |
entryMs | New-point entrance duration; default 250 ms. |
introMs | Initial chart reveal duration; default 500 ms. |
introAnimation | Custom initial reveal function (LineIntroFn). |
historyReveal | Animation function for prepended historical data. |
historyRevealMs | History reveal duration; default 400 ms. |
smoothMs | Last-value transition duration; default 250 ms. |
curve | 'straight', 'smooth', or 'stepped'; default 'straight'. |
linePainter | Custom stroke and area path builder. |
threshold | { value, above, below? } for threshold-based line coloring. |
points | { visible, radius?, color? } for per-point markers; hidden by default. |
ChartContainer Props
The React wrapper accepts the following top-level props; Vue and Svelte use their framework’s binding syntax.
| Prop | Type and behavior |
|---|---|
children | Series, axes, overlays, and other chart components. |
theme | ChartTheme; updates theme colors and typography. |
axis | AxisConfig for axis visibility, bounds, and layout. |
scales | Record<string, YAxisConfig> for secondary Y axes. |
padding | Plot padding. Default: top/bottom 20px, right 3 data intervals, left 0.5 interval. |
viewport | Initial streaming viewport (maxVisibleBars, default 200, and initialRange); read on mount. |
visibleRange | Controlled visible range, as a bar count or an explicit range. |
gradient | Background gradient; default false. |
interactive | Zoom, pan, and crosshair interaction; default true, read on mount. |
grid | Grid options; default { visible: true }. |
fade | Optional canvas edge-fade settings (top, overlap, right, left). |
headerLayout | 'overlay' (default) or 'inline' for title and info bar. |
animations | boolean or AnimationsConfig for chart and series animation behavior. |
perf | Performance instrumentation, such as perfHud(); disabled by default. |
onEdgeReached | Callback when a completed pan/zoom gesture passes a data edge. |
onPointClick | Callback for a canvas point click. |
onPointDoubleClick | Double-click callback; the chart also fits its contents. |
onSeriesHover | Callback when the hovered spatial series changes. |
onReady | Receives the ChartInstance when the chart is created. |
onVisibleRangeChange | Callback for committed range changes. |
onCrosshairMove | Callback with the crosshair position or null. |
style | Wrapper CSS properties; minHeight: 0 overrides the 240px floor. |
className | Wrapper CSS class name. |
Tooltip and Legend Props
| Component prop | Behavior |
|---|---|
Tooltip.sort | Sorts the visible series snapshots. |
Tooltip.format | Formats tooltip values; defaults to adaptive number formatting. |
Tooltip.children | Render function receiving TooltipRenderContext. |
Legend.items | Optional legend-item overrides. |
Legend.position | 'bottom' (default) or 'right'. |
Legend.mode | Legend selection behavior; default 'toggle'. |
Legend.onToggle | Callback receiving LegendToggleInfo. |
Legend.children | Render function receiving LegendRenderContext. |
Theme Customization
Pass a bundled theme such as catppuccin.theme or use createTheme() to derive colors from a background and selected overrides. Here, createTheme() sets the line color and derives the remaining values:
'use client';
import {
  ChartContainer, LineSeries, TimeAxis, YAxis, createTheme,
  type TimePointInput,
} from '@wick-charts/react';
const nightTheme = createTheme({
  name: 'Night Metrics',
  background: '#0f172a',
  line: { color: '#38bdf8' },
});
export function NightChart({ data }: { data: TimePointInput[] }) {
  return (
    <div style={{ height: 320 }}>
      <ChartContainer theme={nightTheme.theme}>
        <LineSeries data={data} />
        <YAxis />
        <TimeAxis />
      </ChartContainer>
    </div>
  );
}
shadcn/ui Chart Blocks
The shadcn/ui registry installs local chart blocks and a WickChart wrapper themed by your shadcn CSS variables. In an initialized React shadcn/ui project, add a live line chart:
npx shadcn@latest add @wick-charts/chart-line-liveimport { ChartLineLive } from '@/components/chart-line-live';
export default function Dashboard() {
return <ChartLineLive />;
}Available Registry Items
- Shared chart files:
wick-theme,wick-chart. - Dashboard blocks:
chart-line-live,chart-sparkline,chart-bar-grouped,chart-pie-donut,chart-area-stacked,chart-heatmap,chart-sankey,chart-radial-progress,chart-radar. - Financial blocks:
chart-candlestick,chart-order-book,chart-line-navigator. - Monitoring blocks:
chart-band-latency,chart-line-annotations,chart-gauge.
Vanilla JavaScript Engine
For a plain HTML page, load the UMD bundle and create a chart through ChartInstance.
<div id="chart" style="width: 640px; height: 320px"></div>
<script src="https://cdn.jsdelivr.net/npm/@wick-charts/react/dist/wick-charts.umd.min.js"></script>
<script>
  const { ChartInstance, LineSeriesDef } = WickCharts;
  const chart = new ChartInstance(document.getElementById('chart'));
  const seriesId = chart.addSeries(LineSeriesDef);
  chart.setSeriesData(seriesId, [
    { time: Date.now() - 120000, value: 100 },
    { time: Date.now() - 60000, value: 118 },
    { time: Date.now(), value: 109 },
  ]);
</script>
Related Resources